
Allianz 222 Annuity Performance
After analyzing the most popular fixed index annuity last week the most common request I received was for a comparison of products I would recommend. To do so, I’m going to take a look at the Allianz 222 alternatives and compare them.
I’m going to show you why the Allianz 222 is not as good as it seems. In comparison to a couple of contracts without crazy restrictions, it just doesn’t really yield all that well.
Allianz 222 Performance
| Starting Account Balance | After Year 1 | After Year 3 | After Year 5 | |
| Allianz 222 | $250,000 | $263,075.00 | $270,715.64 | $300,462.80 |
Allianz 222 Five-year effective yield: 3.746% *Based on past data
Let’s take a look at the numbers that I calculated based on quotes from each insurance company, so the growth comparison is clear.
Allianz 222 Performance Comparison
| After Year 1 | After Year 3 | After Year 5 | Yield | |
| Allianz 222 | $263,075.00 | $270,715.64 | $300,462.80 | 3.746% |
| Midland National RetireVantage | $284,035.00 | $293,464.96 | $329,516.51 | 5.679% |
| Great American Legend 7 | $279,012.50 | $294,637.20 | $342,562.89 | 6.503% |
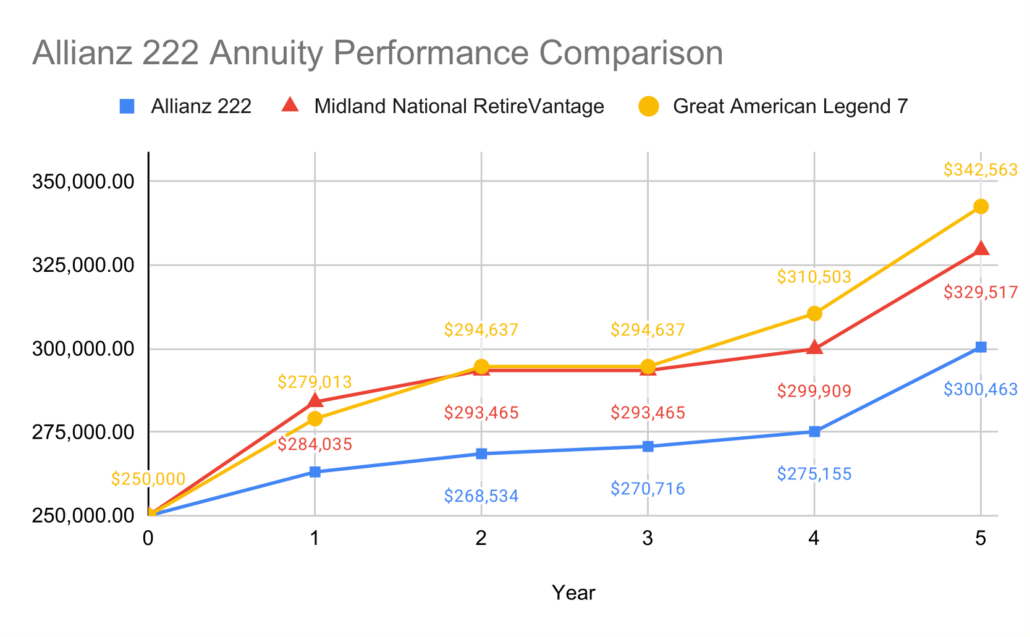
So I’ll ask you, what is better? $300K, $329K or $342K? Over a five-year period, the differences are fairly dramatic. After ten years it’s going to be an even bigger gap. The Protected Income Value of the Allianz 222 would be higher but with the greater cash value of either of the alternatives you could buy more income than you’d get from the 222, and the important thing is you have the choice by going with an alternative. I meet a lot of people who don’t necessarily need the income and even more still who might need it but not exactly in ten years.
How these were calculated
Okay, the numbers I am going to show you below come directly from each carrier. These yields show the period from Jan. 1st, 2013 through Dec. 31, 2017, because that is how the insurance companies present the numbers. Different periods will produce different yields and each contract will change depending on what time period is being analyzed. I took annual yields for each of the chosen indices and equally weighted them in the blended annual yield column. Account value growth is in the far-right column and the ending account value is in bold on the last row. This is how each contract would have performed over an identical five-year term.
Allianz 222 Annuity Performance Calculation
- 25% S&P 500 Monthly Sum with a 1.5% monthly cap
- 25% Nasdaq 100 Annual Point to Point with 3.25% annual cap
- 25%Bloomberg US Dynamic Balance Index II with a 3.2% annual spread
- 25% PIMCO Tactical Balance Index with a 3.1% annual spread
| S&P 500 Monthly Sum | Nasdaq 100 Monthly Sum | Bloomberg with Spread | PIMCO with Spread | Blended Yield | Account Value | |
| $ 250,000.00 | ||||||
| 2013 | 8.18% | 3.25% | 5.18% | 4.31% | 5.23% | $ 263,075.00 |
| 2014 | 2.08% | 3.25% | 2.97% | 0% | 2.08% | $ 268,533.81 |
| 2015 | 0.00% | 3.25% | 0% | 0% | 0.81% | $ 270,715.64 |
| 2016 | 0.00% | 3.25% | 1.15% | 2.16% | 1.64% | $ 275,155.38 |
| 2017 | 11.35% | 3.25% | 11.21% | 10.98% | 9.20% | $ 300,462.80 |
Five year effective yield: 3.746%
One of my new clients came to me after purchasing the Allianz 222 earlier this summer. She retired early at age 52 and happens to be appropriately suited for the contract’s purpose, as she can’t touch her qualified retirement funds until age 60 anyway. Even still, projections for the contract are weak and the only strong point is the bonus.
She was gracious enough to show me her contract so I can see how the index options are allocated and will share that with you. Since she bought it from a guy who claims to be Allianz’s top salesman then I’m assuming the allocations are standard recommendations.
I’m looking back five years to see how a contract with terms from today would have performed since 2013. Yes, all contracts I will reference are longer in term than five years but the past five years had a lot of market activity that will test the validity of an index annuity. You’ll see why by the screenshot below that shows how the S&P 500 performed since this time in 2013.
This shows relatively moderate growth from 2013 through 2016 with a pretty bumpy ride along the way and a steep rise up to 2018 with some volatility at the top that we all recognize from recent events.
Midland National RetireVantage Calculation
Midland National RetireVantage 10:
- 20% S&P 500 Daily Average with a 1% spread
- 20% DJIA Daily Average with a 1.55% spread
- 20% S&P 500 Monthly Sum with a 2.35% monthly cap
- 20% S&P 500 Monthly Average with an 80% participation rate
- 20% DJIA Monthly Average with a 75% participation rate
| S&P 500 Daily Average | DJIA Daily Average | S&P 500 Monthly Sum | S&P 500 Monthly Average | DJIA Monthly Average | Blended Yield | Account Value | |
| $ 250,000.00 | |||||||
| 2013 | 14.26% | 12.99% | 16.81% | 12.68% | 11.33% | 13.61% | $ 284,035.00 |
| 2014 | 3.49% | 0% | 7.66% | 4.16% | 1.29% | 3.32% | $ 293,464.96 |
| 2015 | 0% | 0% | 0% | 0% | 0% | 0.00% | $ 293,464.96 |
| 2016 | 1.51% | 1.37% | 3.09% | 2.42% | 2.59% | 2.20% | $ 299,909.45 |
| 2017 | 8.39% | 8.51% | 16.12% | 8.09% | 8.25% | 9.87% | $ 329,516.51 |
Five-year effective yield: 5.679%
Great American Legend 7 Calculation
Great American Life Legend 7:
- 25% S&P 500 Monthly Sum with a 2.5% monthly cap
- 25% S&P 500 Annual Point to Point with 6.4% annual cap
- 25% S&P 500 Risk Control 10% with 70% participation rate
- 25% S&P Retiree Spending with 75% participation rate
| S&P 500 Monthly Sum | S&P 500 Annual PTP | S&P 500 Risk Control | S&P Retiree Spending | Blended Yield | Account Value | |
| $ 250,000.00 | ||||||
| 2013 | 16.20% | 6.40% | 15.34% | 8.48% | 11.61% | $ 279,012.50 |
| 2014 | 6.58% | 6.40% | 3.16% | 6.26% | 5.60% | $ 294,637.20 |
| 2015 | 0.00% | 0.00% | 0.00% | 0.00% | 0.00% | $ 294,637.20 |
| 2016 | 5.30% | 6.40% | 3.82% | 6.02% | 5.39% | $ 310,503.41 |
| 2017 | 15.41% | 6.40% | 13.58% | 5.91% | 10.33% | $ 342,562.89 |
Five-year effective yield: 6.503%
From an account value perspective, the Midland and Great American contracts substantially outpace growth over five years. For those of you who may get defensive and suggest that Allianz would do better with a different allocation, I will say that each of the others could be allocated differently to produce more as well. I didn’t cherry-pick data and could change any of the above to create better or worse returns.
Another frequent comment I received last week was in regards to the death benefit of the Allianz 222 which pays out the entire Protected Income Value in five annual installments. I did intentionally leave that out as it is irrelevant when you calculate the actual return. Most agents are not inquisitive enough to look into it and just rely on the beneficiaries not knowing any better. The death benefit is just window dressing and the 222 is not the only contract that pays the income value out as a death benefit over five years.
So, many of you asked for a recommendation and there it is. I have to be competitive so I had to find contracts that would grow best and with growth you can beat any bonus or income guarantee available. When you add an asset management strategy that shows you how to use it then it gets even better.
Many advisors will tell you otherwise but none can do the analysis to prove it. If you have any questions about Allianz 222 alternatives or would like more detail on any of the above points please call or make an appointment and we can talk about it.
Continue reading:
About Midland National
- Why Midland National is My #1 Recommendation
- Best Growth Fixed Indexed Annuity: Midland National RetireVantage 10
About Allianz 222
- Hidden Fees in the Allianz 222
- Product Spotlight: Allianz 222
- Allianz 222 vs Fully Guaranteed Income
Last Updated on April 2, 2024 by Bryan Anderson


Hi Brian What are the expenses ratios per year that you pay for these fixed index annuities and how many years is the surrender charges.
Bill, I’m sorry I missed this comment. The fixed index annuities I recommend come with no expenses or fees of any kind. Reasonable options range from five to ten years to surrender and I feel as though the shorter the better.
I missed your analysis of the Allianz 222. Can you please direct me to it? It turns out someone is trying to sell us that Annuity and I know that’s the annuity that gets sold to everyone. Another “annuity expert” told me it was the worst Annuity out there –or at least there are a lot of other better choices. This is so confusing because it’s hard to know which “expert” to believe. Thanks.
Pam- you can find my report on the Allianz 222 at the link below.
thanks!
https://annuitystraighttalk.com/wp-content/uploads/2019/04/Updated-Truth-About-Allianz-222.pdf
Is the 40% bonus the 222 offers calculate into these returns? It would seem if you hold the annuity for 10 years and take the lifetime option, then the upfront 40% bump would surpass the other annuities returns??? You would be starting out with a $350k credit in this scenario correct????
Thanks!!!!
Yes, it is included. Do you think I would forget about that? The bonus leads way to lower payout rates than other products so it all evens out in the end. Too many people focus only on the large number without looking at the bottom line. That’s why there are thousands of people unhappy with purchasing that product. Much of it was sold under false pretenses.
The financial adviser that recommended this product told me about the bonus but the performance of this annuity has been terrible. I can only get 2.2 % increase in the eight years that I have hold this annuity. I assume the financial advisor got a big bonus check. This is the reason that he recommended this terrible annuity. Good luck to everyone.
Unfortunately a lot of them have gone that way. I’ve been called a liar plenty of times but I’ve been speaking out about this contract for almost ten years. If you’ve got two years left it would be a good idea to reevaluate options at that time and you might find something that suits you better for income or growth.