
The S&P 500 Over 25 Years
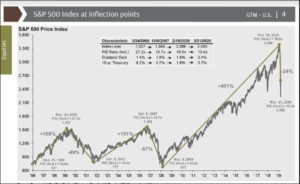
Take a look at the chart below and you’ll see the values of the S&P 500 since 1996. This was recently released from JP Morgan and I grabbed a screenshot in order to point out a few things. It maps out the high and low points or extreme volatility of probably the second-best market period in history. Throughout, everyone became addicted to the highs and devastated by the lows. Exceptional yields were realized along with crippling losses. It hits home with me because I have worked with retirees in each period, with the exception of the high point in ’99. What’s interesting to me is how quickly sentiments change because every point along this chart I heard someone make a definitive statement about what was about to happen. Some guessed right but most guessed wrong.
If you go back to the high point of March 24, 2000 and compare it to where you are today, the yield might not be so impressive. Had you entered the market at that starting point and exited on February 19, 2020 you would have had an effective yield of something in the neighborhood of 4.25%. But if you didn’t get out and rode it all the way thru the end of March 2020 your yield over 20 years would be a fair bit less than 3%. Now, dividends would have enhanced the yield by around 2.5% on average but you’re still not crushing it.
There are two lessons here. First, reducing volatility DOES increase yield over time. The second lesson requires a story…
Early in the week I spoke with a guy in his early 50s. Protection of assets is his mindset so he’s looking at annuities. He has been following this blog for a few years and figured it was time to reach out and schedule an appointment. I learned about his strategy of protecting 75% of his assets and only putting 25% in the stock market. His recent losses didn’t affect him that much and he thought this might be a good opportunity to make a move. We didn’t talk about how much money he has or what his retirement goals are because that’s several years away but I did get to share with him something I’ve learned of successful people and I’ll share that with you now for the second lesson.
The vast majority of people I know who have been successful got where they are because they were good at saving money. Investments were calculated moves but setting money aside consistently always produces results. Most of you look at the assets you have and think that it’s the stock market that produced it, when the money you saved is what made the difference.
The yield on the S&P 500 isn’t that great over the past 25 years but most of you don’t see it so dramatically because contributions created more of your growth than did the actual yield. Take some time to think about it and you’ll realize that the market never really helped, it only caused stress and now might be the time to change your perspective.
If one more person gripes to me about the yield of an annuity I’m going to use this chart. I’ve seen a lot of things beat this in the last 20 years but I write about that too much. Once you realize that the market really isn’t giving you anything then you might decide to keep saving money and spend as you see fit. How nice would it be to not worry about a portfolio right now?
Call or email any time…
Bryan
Further readings:
The Fixed Indexed Annuity Guide
Are Fixed Indexed Annuities a Good Investment?
How Much Do Fixed Annuities Pay?
Last Updated on December 12, 2023 by Bryan Anderson

